|
||||
|
||||
|
1. Introduction
2. Getting Forecast 2.1 Web Interface 2.2 Application Programming Interface (API) 2.2.1 Graphical API 2.2.2 Machine-readable API 2.2.3 Variables 2.3 Products and Icon Set Definition 2.3.1 CIVIL 2.3.2 CIVIL Light 2.3.3 Two-Week-Overview 2.3.4 ASTRO 2.3.5 METEO 3. Weather Chart 4. Frequently Asked Questions 5. Acknowledgement and Disclaimer |
Last Update: November 1, 2012 1. Introduction7Timer! is a series of web-based meteorological forecast products, mainly derived from the NOAA/NCEP-based numeric weather model, the Global Forecast System (GFS). 7Timer! was firstly established in July 2005 as an exploration product under supported of the National Astronomical Observatories of China and had been largely renovated in 2008 and 2011. Currently it is supported by the Shanghai Astronomical Observatory of Chinese Academy of Sciences. 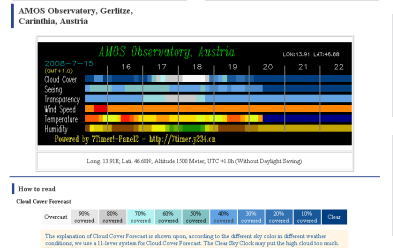 The 2nd version of 7Timer! - APanel, the predecessor of ASTRO 7Timer! produces high-resolution forecast for the entire globe that covering about 1.5 million geographic points, and would be updated four times a day. It also produces specialized products for users with different concentrations such as astronomy or meteorology. 2. Getting ForecastThe forecast can be accessed by visiting the web interface at www.7timer.info, or by calling the application programming interface (API). 2.1 Web InterfaceThe web interface at www.7timer.info is written with support from the 3rd version of Google Maps API that works in Internet Explorer 7.0+, Firefox 3.0+, Safari 4+, Google Chrome and Android browsers. To get the forecast for a site, left-click the site on the map, and move the cursor over the marker, the information box consisting links to forecast pages will then be displayed. For users unable to load Google Maps API, an alternative method to directly access the forecast page is provided. Users may then using the site search engine to find locations. This method works well in most platforms supporting JavaScript, including Internet Explorer 6.0. Please notice that some products require a longer loading time (such as CIVIL and METEO), so please wait patiently. You may also use the search form on top of the map to find a site. Such queries will be forwarded to and processed by Google. Default geolocation method is GeoIP, meaning by default your current location will be derived by the IP address of your device. You may wish to try W3C geolocation method for higher usability and accuracy; however, W3C geolocation only works in Firefox 3.5+, Google Chrome, Opera 10.6+, Internet Explorer 9.0+, and Safari 5+. On mobile devices, W3C geolocation works on iPhone, Google Android, Maemo and Opera Mobile 10.1+. Geolocation by Google Gears is not supported at this time. 2.2 Application Programming Interface (API)The application programming interface (API) of 7Timer! is highly flexible and is very easy to use. They can be used directly without registering an API key. Currently, we offer two types of APIs for users with different purposes: graphical and machine-readable APIs. 2.2.1 Graphical APIThe graphical API will display the forecast diagram as seen at the 7Timer! website. The URL to the graphical API of the site you specified is like: http://www.7timer.info/bin/astro.php?lon=113.17&lat=23.09&ac=0&lang=en&unit=metric&output=internal&tzshift=0 The graphical API, when called, will produce a PNG-type image, so you may use <img> tag to include the forecast diagrams in your website. 2.2.2 Machine-readable APIThe machine-readable API will return a set of data that can be used directly by application. By far, APIs in two standards are available: Extensible Markup Language (XML) or JavaScript Object Notation (JSON). The URLs to these two standards are similar as: http://www.7timer.info/bin/api.pl?lon=113.17&lat=23.09&product=astro&output=xml There are four parameters that need to be set to successfully call the API: lon and lat for geographic coordinate of the location, product for the product you wish to use (any of "astro", "civil", "civillight", "meteo" or "two"), and output for the standard you wish to use (either "xml" or "json"). Summary of meteorological elements provided by the corresponding API of each product is given below.
2.2.3 VariablesA couple of variables can be set by the API user. The usages of these variables are explained below. lon, lat – Geographic coordinates of the specified site, must be given as pure float numbers, such as +23.090 or -23.090. At this stage, the precision of any incoming coordinate float number is expected to be 0.001. Incoming float with higher precision will be rounded. 2.3 Products and Icon Set Definition7Timer! offers four types of products for users with different concentrations such as civil users, astronomers and meteorologists. 2.3.1 CIVILCIVIL is intended for civil users. It will display the forecasted weather condition for the next 8 days with a set of easy-to-read weather icons. Explanations of each icon, as well as the definition of values returned by machine-readable API, are given below. Icon Definition
Definition of API Output Value
2.3.2 CIVIL LightCIVIL Light is a simplfied version of CIVIL which only provide 7-day forecast on a day-to-day basis. The definition of icons and API output values are mostly identical to CIVIL. 2.3.3 Two-Week-OverviewTwo-Week-Overview (TWO) is intended for civil users. It will display the forecasted weather condition for the next 9-16 days with a set of easy-to-read weather icons. Explanation of each icon, as well as the definition of values returned by machine-readable API, are given below. Icon Definition
Definition of API Output Value
Please be aware that the forecast is highly uncertain given to the large leading time of TWO. 2.3.4 ASTROAs the oldest product that 7Timer! has ever provided, ASTRO product is mainly intended for astronomical purpose. The forecast range is 3-day and has included several elements that concerns astronomers most – such as cloud cover, astronomical seeing and atmospheric transparency. For details of the forecast method, see Publ. Astron. Soc. Pac., 123, 113, and references therein. Explanation of each icon is given below. Icon Definition
Definition of API Output Value
The "Altitude Correction" function in older version is now restored. You may consider to set this function if your location is significantly higher than its adjacent areas (for example, when the location is on a mountain top). A good trick to check the necessarity of this function is to compare the forecasted and the actual temperature. When there is a large difference (say, over 5-10 degrees), you may consider to active this function. The Altitude Correction can be set to 2km or 7km. 2.3.5 METEOMETEO product is mainly intended for meteorological purpose and has included a number of meteorological elements, such as the relative humidity and wind profile from 950hPa to 200hPa. The forecasts for wind and cloud cover are plotted following the universal meteorological guidelines (users might read Wikipedia article at http://en.wikipedia.org/wiki/Station_model for a quick look of such guidelines). The forecast range is 8-day (192-hour). Definition of API Output Value
3. Weather ChartThe weather charts are plotted from the NOAA/NCEP forecast binaries and are mainly intended for astronomical or meteorological purpose. Most elements are plotted as-is, while independent legends are needed for wind (streamline) and precipitation charts. These legends are given below. Legend of Wind Speed
Legend of Precipitation Type
Legend of Precipitation Amount
4. Frequently Asked QuestionsQ: The title of forecast page is "forecast for unknown site" even the site I click is in a big city. Why is this?A: The geolocation conversion at the forecast page is handled by Google Geocoding API which sets a daily query limit of 2,500 currently, so "unknown site" will be shown if the limit is exceed that day. I may consider writing a build-in geolocation database in future to work around this problem. Q: Some question marks are shown in ASTRO forecast when Alt Corr is active.A: This is normal – you will see question marks on precipitation and instability data in ASTRO product when Alt Corr is enabled. This is because the GFS data only provides the precipitation and lifted index data at ground level. To avoid confusion, data for these two elements will not be plotted when the forecast site is not at surface (i.e. Alt Corr is enabled.) 5. Acknowledgement and Disclaimer7Timer! was supported by Dr. Cui Chenzhou on behalf of the National Astronomical Observatories of China in 2005-2010, and is then supported from Dr. Lin Qing and Mr. Tang Haiming of the Chinese Network for Astronomy Popularization, Shanghai Astronomical Observatory, Chinese Academy of Sciences. Big thanks also go to Attilla Danko who inspired me to establish 7Timer!; to Li Zuqiang and Dr. Johnson Lau who had been extensively involved in the development of data reduction scripts; to Shi Liaoshan who help testing every new releases; to littlePig and Max who had given help on starting code works of Google Maps API; as well as to numerous people who have contributed helpful suggestions and encouragements. The weather data distributed in this site are entirely free – you can use or redistribute them as long as you are not using them for commercial purpose. Program developers are asked to notify me when using the data so I can track the server workload. Just be aware that weather forecasting is as challenging as in the stock market – so using these data is at your own risk. |
|||||||||||||||||||||||||||||||||||||||||||||||||||||||||||||||||||||||||||||||||||||||||||||||||||||||||||||||||||||||||||||||||||||||||||||||||||||||||||||||||||||||||||||||||||||||||||||||||||||||||||||||||||||||||||||||||||||||||||||||||||||||||||||||||||||||||||||||||||||||||||||||||||||||||||||||||||||||||||||||||||||||||||||||||||||||||||||||||||||||||||||||||||||||||||||||||||||||||||||||||||||||||||||||||||||||||||||||||||||||||||||||||||||||||||||||||||||||||||||||||||||||||||||||||||||||||||||||||||||||||||||||||||||||||||||||||||||||||||||||||||||||||||||||||||||||||||||||||||||||||||||||||||||||||||||||||||||||||||||||||||||||||||||||||||||||||||||||||||||||||||||||||||||||||||||||||||||||||||||||||||||||||||||||||||||||||||||||||||||||||||||||||||||||||||||||
![]() 7Timer! thanks Xasteria for iOS for their generous support.
7Timer! thanks Xasteria for iOS for their generous support.